Located in the city of Chicago, Cook County, Illinois, the Cook County Jail - Division 11 is a 1536-bed facility. You can call them 24 hours a day for inmate details at 773-674-7100.
This jail serves as the processing center for offenders arrested for misdemeanors and felonies. They are brought here for booking and processing, and depending on their charges, they may be held until they are either bonded out, released on recognizance, or ordered to remain in custody until their trial is complete.
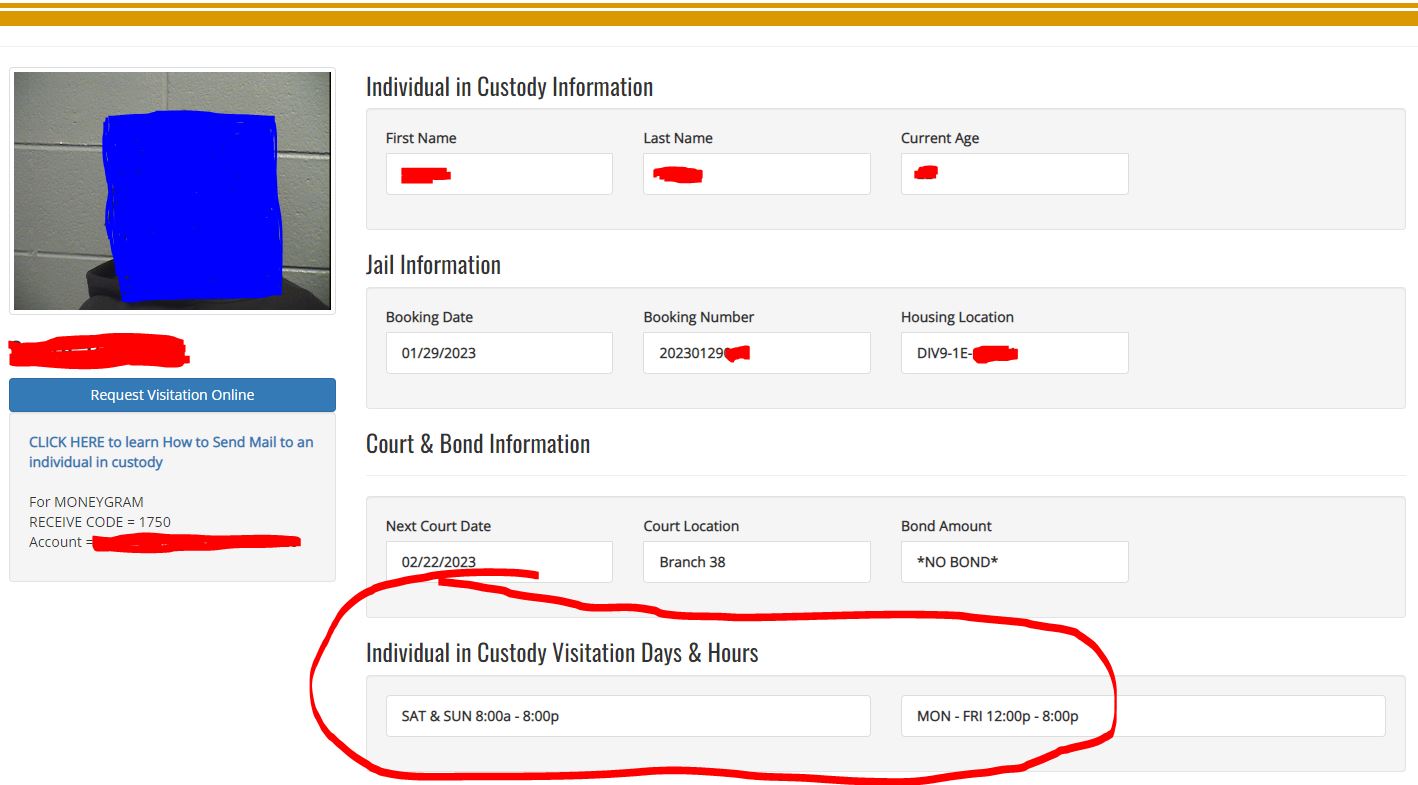
Use the inmate search tool to find out who is in custody at this facility.
Inmates with sentences under one year will serve their time at this jail, while those sentenced to longer terms will be transferred to either the Illinois State Prison System or the Federal Bureau of Prisons.
This page offers helpful information regarding inmate services like the visitation schedule, funding an inmate's account, sending mail, phone calls, voicemail, emailing and texting, tablet rentals, bail bonds, and commissary purchases.
Make sure to keep the inmate's jail ID or booking number, as it is often needed for correspondence or communication. If you're unable to locate it online, you can call Cook County Jail - Division 11 at 773-674-7100 for further assistance.
Phone: 773-674-7100
Physical Address:
3015 S. California Blvd.
Chicago, IL 60608
Mailing Address (personal mail):
NAME:
BOOKING #:
2700 S. California Ave.
Chicago, IL 60608
Mailing Address (legal mail or subscriptions):
NAME:
BOOKING #:
2700 S. California Ave.
Chicago, IL 60608
Other Jails and Prisons
To search for an inmate in the Cook County Jail - Division 11, review their criminal charges, the amount of their bond, when they can get visits, or even view their mugshot, go to the Official Jail Inmate Roster, or call the jail at 773-674-7100 for the information you are looking for. You can also look up the Cook County Criminal Court or any court in Illinois, as well as criminal court case information regarding an offender.
The Cook County Court Clerk has a lot more specific information you can use to find more about an offender's criminal court case as well.
Cook County Jail - Division 11 Inmate Search
The Cook County Jail - Division 11 maintains an average of 1536 offenders in custody on any given day. The Cook County Jail - Division 11 has a monthly turnover of 40% of their inmate population, another 30% turnover every 90 days, another 20% every six months, and approximately 10% stay incarcerated between six and twelve months. Every year Cook County law enforcement agencies arrest and detain approximately 169,460 offenders.
The following charts of Cook County inmate population demographics are updated daily. The information shown is for today. For research purposes we have broken down the inmates by sex, age, ethnicity, and criminal charges.
The information is compiled from the Cook County Corrections Department, the state of Illinois Department of Corrections, as well as the United States Department of Justice and Census Bureau records. It represents every person in custody in Cook County.
For complete information on how to get directions, bond, visit, mail, send and receive email and texts, receive phone calls, and send money or commissary to an inmate, find arrest information for Cook County and other counties surrounding this one, scroll down this page. We have a section for each.
We also provide photos of the jail that we have collected over the years.
⇓ Learn more ⇓ Show lessAfter an arrest, individuals are taken to Cook County Jail - Division 11 where they go through booking. This process includes identifying the person, reviewing charges, and determining whether they will be released on their own, eligible for bail, or detained until their court date.
It’s crucial to remain silent after being arrested. Anything said may be used in court, so it’s better to refrain from speaking until consulting with an attorney.
The following steps outline the booking procedure at Cook County Jail - Division 11:
Booking can take from a short hour to longer periods, especially on busy nights or with uncooperative individuals. For inquiries about posting bond for an arrestee, call the facility at 773-674-7100.
Once someone is booked at Cook County Jail - Division 11 in Chicago after an arrest, there are several outcomes:
1. They may be released without paying bail, agreeing to show up on a scheduled date.
2. They may remain in custody until their court appearance.
3. They can pay a bail or bond for release. Call 773-674-7100 for bail details.
Bail payments can take several forms.

For detailed information about the bail process in Cook County, Illinois, see the Cook County Jail - Division 11 Bail FAQ.
Learn even more ⇓ Learn more ⇓ Show lessHow Do You Visit an Inmate in the Cook County Jail - Division 11? What is the Schedule?
(Scroll down for Video Visitation instructions)
As long as there is a threat of inmates getting sick from COVID or other pandemic related illness, the following rules will be in affect for all inmates and their visitors:
Entrance Instructions: Visitors for Division 11 must enter at the post located at 3015 S. California Blvd.
| DAY | INMATES | TIME |
| SUN | AA, AB, AC, AD, CA, CB, CC, CD |
8:00AM-1:00PM |
| SUN | BF, BG, BH, BJ, DA, DB, DC, DD |
3:30PM-8:30PM |
| MON | BA, BB, BC, BD, CF, CG, CH, CJ |
3:30PM-8:30PM |
| TUE | AA, AB, AC, AD, BF, BG, BH, BJ, DA, DB, DC, DD |
3:30PM-8:30PM |
| WED | AF ,AG, AH, AJ, CA, CB, CC, CD, DF, DG, DH, DJ |
3:30PM-8:30PM |
| THU | NO VISITS | --- |
| FRI | NO VISITS | --- |
| SAT | AF, AG, AH, AJ, DF, DG, DH, DJ |
8:00AM-1:00PM |
| SAT | BA, BB, BC, BD, CF, CG, CH, CJ |
3:30PM-8:30PM |
Once regular in-person visitation returns in 2023, the following will link you to the actual visitation schedules for each Cook County Jail Division:
Video Visitation is done using Microsoft Teams Group Chat Software.

We’ve compiled a list of Frequently Asked Questions and Answers for everything you need to know about Cook County Jail - Division 11’s Inmate Visitation Policies, Rules and Guidelines. If you still have questions after reviewing these FAQs, call 773-674-7100 for further assistance.
Learn even more ⇓ Learn more ⇓ Show lessCan I Use My Computer or Phone to Have a Remote Video Visit with an Inmate in the Cook County Jail - Division 11?
Video Visitation is done using Microsoft Teams Group Chat Software.
We’ve compiled a list of Frequently Asked Questions and Answers for everything you need to know about Cook County Jail - Division 11’s Video Remote Visitation Policies, Rules and Guidelines. If you still have questions after reviewing these FAQs, call 773-674-7100 for further assistance.
Learn even more ⇓ Learn more ⇓ Show lessHow Do You Deposit Money for an Inmate in the Cook County Jail - Division 11?
We’ve compiled a list of Frequently Asked Questions and Answers for everything you need to know about Cook County Jail - Division 11’s Inmate Money and Trust Fund Policies, Rules and Guidelines. If you still have questions after reviewing these FAQs, call 773-674-7100 for further assistance.
Learn even more ⇓ Learn more ⇓ Show lessHow Do I Receive Phone Calls from an Inmate in the Cook County Jail - Division 11?
We’ve compiled a list of Frequently Asked Questions and Answers for everything you need to know about Cook County Jail - Division 11’s Inmate Phone Policies, Rules and Guidelines. If you still have questions after reviewing these FAQs, call 773-674-7100 for further assistance.
Learn even more ⇓ Learn more ⇓ Show lessHow do I Mail an Inmate in the Cook County Jail - Division 11, and what can I send them?

Postcards
The Cook County Jail - Division 11 allows inmates to receive pre-metered postcards like the type purchased from the post office. They may also allow certain photo postcards as long as they have not been tampered with or contain images that may be considered to be obscene or violent in nature. It is best to only use blue or black ink. Always include your name and return address.
Envelopes
The Cook County Jail - Division 11 also allows envelopes to be mailed to inmates. It is best to only use blue or black ink.
Postcards and envelopes MUST HAVE the sender's full name and return address on the envelope.
Postcards and envelopes MUST be mailed to the following address:
NAME:
BOOKING #:
2700 S. California Ave.
Chicago, IL 60608
Legal Mail

Send all Legal Mail to this Address:
NAME:
BOOKING #:
2700 S. California Ave.
Chicago, IL 60608
Newspapers
Newspapers may also be mailed to an inmate as long as they are shipped directly from the publisher.
Magazines
News, special interest or sports magazines may also be mailed to an inmate as long as they are shipped directly from the publisher. Any magazines that contain profanity, weapons, pornography or other content that is adult in nature will be confiscated by the jail staff and will NOT be delivered to the inmate.
Books
The Cook County Jail - Division 11 allows books to be mailed directly to the jail from a reputable source such as Amazon, Barnes & Noble or Books-A-Million. You can order them directly from your computer and have them shipped to the inmate at the address noted.
Books must NOT contain images or content that are considered excessively violent, pornographic or obscene. Any book that does not meet the Cook County Jail - Division 11 standards will be disposed of.
Hard cover books will not be accepted by the jail due to their potential to be used as a weapon.
All newspapers, magazines and books are to be shipped to:
NAME:
BOOKING #:
2700 S. California Ave.
Chicago, IL 60608
We’ve compiled a list of Frequently Asked Questions and Answers for everything you need to know about Cook County Jail - Division 11’s Inmate Mail Policies, Rules and Guidelines. If you still have questions after reviewing these FAQs, call 773-674-7100 for further assistance.
Learn even more ⇓ Learn more ⇓ Show lessCan I purchase Commissary Online for an Inmate in the Cook County Jail - Division 11, and what can I purchase?
We’ve compiled a list of Frequently Asked Questions and Answers for everything you need to know about Cook County Jail - Division 11’s Commissary Policies, Rules and Guidelines. If you still have questions after reviewing these FAQs, call 773-674-7100 for further assistance.
Learn even more ⇓ Learn more ⇓ Show lessHow Can I Communicate with an Inmate in the Cook County Jail - Division 11 using an Online Messaging Service?
We’ve compiled a list of Frequently Asked Questions and Answers for everything you need to know about Cook County Jail - Division 11’s Text and Email Policies, Rules and Guidelines. If you still have questions after reviewing these FAQs, call 773-674-7100 for further assistance.
Learn even more ⇓ Learn more ⇓ Show lessDo Inmates in the Cook County Jail - Division 11 have Access to Tablets or Computers?
We’ve compiled a list of Frequently Asked Questions and Answers for everything you need to know about Cook County Jail - Division 11’s Tablet Policies, Rules and Guidelines. If you still have questions after reviewing these FAQs, call 773-674-7100 for further assistance.
Learn even more ⇓ Learn more ⇓ Show lessWhat are the other City and County Jails in Cook County?
What are the other Jails in the Neighboring Counties surrounding Cook County?
The Cook County Jail - Division 11 serves the following cities and towns of Cook County: Alsip, Arlington Heights, Barrington, Bartlett, Bedford Park, Bellwood, Berkeley, Berwyn, Blue Island, Bridgeview, Broadview, Brookfield, Buffalo Grove, Burnham, Burr Ridge, Calumet City, Calumet Park, Chicago, Chicago Heights, Chicago Ridge, Cicero, Clarendon Hills, Country Club Hills, Countryside, Des Plaines, Dolton, Elk Grove Village, Elmhurst, Elmwood Park, Evanston, Evergreen Park, Flossmoor, Forest Park, Forest View, Franklin Park, Glencoe, Glenview, Glenwood, Golf, Harvey, Harwood Heights, Hazel Crest, Hickory Hills, Hillside, Hinsdale, Hodgkins, Hoffman Estates, Homewood, Inverness, Justice, La Grange, La Grange Park, Lansing, Lemont, Lincolnwood, Lynwood, Lyons, Markham, Matteson, Maywood, McCook, Melrose Park, Merrionette Park, Midlothian, Morton Grove, Mount Prospect, Niles, Norridge, North Chicago, Northbrook, Northfield, Northlake, Oak Forest, Oak Lawn, Oak Park, Olympia Fields, Orland Hills, Orland Park, Palatine, Palos Heights, Palos Hills, Palos Park, Park Forest, Park Ridge, Posen, Prospect Heights, Richton Park, River Forest, River Grove, Riverdale, Riverside, Robbins, Rolling Meadows, Rosemont, Schaumburg, Schiller Park, Skokie, South Holland, Steger, Streamwood, Summit, Thornton, Tinley Park, University Park, Westchester, Western Springs, Wheeling, Wilmette, Winnetka and Worth.