Phone: 434-455-7878
Physical Address:
1400 Florida Avenue
Lynchburg, VA 25401
Mailing Address (personal mail):
Juvenile's first and last name
c/o Lynchburg Regional Juvenile Detention Center
1400 Florida Ave.
Lynchburg, VA 25401
Other Jails and Prisons
To search for an inmate in the Lynchburg Regional Juvenile Detention Center, review their criminal charges, the amount of their bond, when they can get visits, or even view their mugshot, go to the Official Jail Inmate Roster, or call the jail at 434-455-7878 for the information you are looking for. You can also look up Bedford County Criminal Court Cases, as well as Virginia Criminal Court cases online for every other county, and daily court dockets for each of the state's courts. If you are not sure what court your inmate is to appear in, this is a list of all the courts in Virginia, broken down by each court circuit.
Lynchburg Regional Juvenile Detention Center Inmate Search
The Lynchburg Regional Juvenile Detention Center maintains an average of 48 offenders in custody on any given day. The Lynchburg Regional Juvenile Detention Center has a monthly turnover of 40% of their inmate population, another 30% turnover every 90 days, another 20% every six months, and approximately 10% stay incarcerated between six and twelve months. Every year Bedford County law enforcement agencies arrest and detain approximately 4,160 offenders.
The following charts of Bedford County inmate population demographics are updated daily. The information shown is for today. For research purposes we have broken down the inmates by sex, age, ethnicity, and criminal charges.
The information is compiled from the Bedford County Corrections Department, the state of Virginia Department of Corrections, as well as the United States Department of Justice and Census Bureau records. It represents every person in custody in Bedford County.
For complete information on how to get directions, bond, visit, mail, send and receive email and texts, receive phone calls, and send money or commissary to an inmate, find arrest information for Bedford County and other counties surrounding this one, scroll down this page. We have a section for each.
We also provide photos of the jail that we have collected over the years.
⇓ Learn more ⇓ Show lessAfter arrest, individuals are processed at Lynchburg Regional Juvenile Detention Center, where they undergo a series of steps that determine their charges and whether they’ll be released on their own recognizance, allowed to post bail, or held until their court date.
The first rule for anyone arrested is to remain silent. Anything they say can be used in court, so it’s best to speak only to an attorney about the incident.
Here are the typical stages of the booking process at Lynchburg Regional Juvenile Detention Center:
Booking time varies, with some cases completed in an hour, but more complex cases, or those involving uncooperative behavior, can take up to 48 hours. If you need details about an offender’s bail or bond, contact the facility at 434-455-7878.
If someone is taken to Lynchburg Regional Juvenile Detention Center in Lynchburg for booking, the next steps depend on their case:
1. The individual may be released without bail, under a promise to appear at a court hearing.
2. They could be held in custody until their trial.
3. They may post a bail or bond for release. To find out the exact bail amount, call 434-455-7878.
Bail payments can be handled in various ways.

For a comprehensive guide to the bail process in Bedford County, Virginia, visit the Lynchburg Regional Juvenile Detention Center Bail FAQ page.
Learn even more ⇓ Learn more ⇓ Show lessHow Do You Visit an Inmate in the Lynchburg Regional Juvenile Detention Center? What is the Schedule?
1400 Florida Avenue
Lynchburg, VA 25401
434-455-7878
ON SITE VISITATION SCHEDULE - ALWAYS CALL 434-455-7878 TO CONFIRM VISITATION SCHEDULE!
| DAY | TIMES |
| SUNDAY | 9:00AM - 11:00AM 2:00PM - 4:00PM |
| MONDAY | 9:00AM - 11:00AM 2:00PM - 4:00PM 6:00PM - 8:00PM |
| TUESDAY | 9:00AM - 11:00AM 2:00PM - 4:00PM 6:00PM - 8:00PM |
| WEDNESDAY | 9:00AM - 11:00AM 2:00PM - 4:00PM 6:00PM - 8:00PM |
| THURSDAY | 9:00AM - 11:00AM 2:00PM - 4:00PM 6:00PM - 8:00PM |
| FRIDAY | 9:00AM - 11:00AM 2:00PM - 4:00PM 6:00PM - 8:00PM |
| SATURDAY | 9:00AM - 11:00AM 2:00PM - 4:00PM |
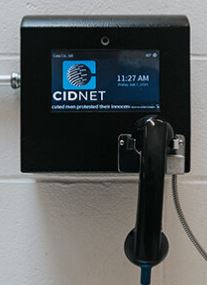
Lynchburg Regional Juvenile Detention Center uses CIDNET for Remote Video Visitation between inmates and their friends and family.
Register here.

Frequently Asked Questions
Instructions on How to Use CIDNET
CIDNET Instrucciones
Contact Customer Support
We’ve compiled a list of Frequently Asked Questions and Answers for everything you need to know about Lynchburg Regional Juvenile Detention Center’s Inmate Visitation Policies, Rules and Guidelines. If you still have questions after reviewing these FAQs, call 434-455-7878 for further assistance.
Learn even more ⇓ Learn more ⇓ Show lessCan I Use My Computer or Phone to Have a Remote Video Visit with an Inmate in the Lynchburg Regional Juvenile Detention Center?
Friends & Family Portal Information
Frequently Asked Questions
Instructions on How to Use CIDNET
CIDNET Instrucciones
Contact Customer Support
We’ve compiled a list of Frequently Asked Questions and Answers for everything you need to know about Lynchburg Regional Juvenile Detention Center’s Video Remote Visitation Policies, Rules and Guidelines. If you still have questions after reviewing these FAQs, call 434-455-7878 for further assistance.
Learn even more ⇓ Learn more ⇓ Show lessHow Do You Deposit Money for an Inmate in the Lynchburg Regional Juvenile Detention Center?
We’ve compiled a list of Frequently Asked Questions and Answers for everything you need to know about Lynchburg Regional Juvenile Detention Center’s Inmate Money and Trust Fund Policies, Rules and Guidelines. If you still have questions after reviewing these FAQs, call 434-455-7878 for further assistance.
Learn even more ⇓ Learn more ⇓ Show lessHow Do I Receive Phone Calls from an Inmate in the Lynchburg Regional Juvenile Detention Center?
To register and sign up for a phone account with CIDNET Inmate Phone Service, follow the instructions below:
For all the information you need to know, including instructions, policies, tips and solutions to possible issues regarding making phone calls with an inmate in Bedford County, visit our full page guide.
NOTE: All phone conversations are recorded. Whatever you talk about, can and will be used against your inmate in court. Never discuss their pending criminal case!
Also, be warned that some phone providers are collecting voice prints for a database which law enforcement agencies are building.
We’ve compiled a list of Frequently Asked Questions and Answers for everything you need to know about Lynchburg Regional Juvenile Detention Center’s Inmate Phone Policies, Rules and Guidelines. If you still have questions after reviewing these FAQs, call 434-455-7878 for further assistance.
Learn even more ⇓ Learn more ⇓ Show lessHow do I Mail an Inmate in the Lynchburg Regional Juvenile Detention Center, and what can I send them?

Postcards
The Lynchburg Regional Juvenile Detention Center allows inmates to receive pre-metered postcards like the type purchased from the post office. They may also allow certain photo postcards as long as they have not been tampered with or contain images that may be considered to be obscene or violent in nature. It is best to only use blue or black ink. Always include your name and return address.
Envelopes
The Lynchburg Regional Juvenile Detention Center also allows envelopes to be mailed to inmates. It is best to only use blue or black ink.
Postcards and envelopes MUST HAVE the sender's full name and return address on the envelope.
Postcards and envelopes MUST be mailed to the following address:
1400 Florida Avenue
Lynchburg, VA 25401
Legal Mail

Send all Legal Mail to this Address:
1400 Florida Avenue
Lynchburg, VA 25401
Newspapers
Newspapers may also be mailed to an inmate as long as they are shipped directly from the publisher.
Magazines
News, special interest or sports magazines may also be mailed to an inmate as long as they are shipped directly from the publisher. Any magazines that contain profanity, weapons, pornography or other content that is adult in nature will be confiscated by the jail staff and will NOT be delivered to the inmate.
Books
The Lynchburg Regional Juvenile Detention Center allows books to be mailed directly to the jail from a reputable source such as Amazon, Barnes & Noble or Books-A-Million. You can order them directly from your computer and have them shipped to the inmate at the address noted.
Books must NOT contain images or content that are considered excessively violent, pornographic or obscene. Any book that does not meet the Lynchburg Regional Juvenile Detention Center standards will be disposed of.
Hard cover books will not be accepted by the jail due to their potential to be used as a weapon.
All newspapers, magazines and books are to be shipped to:
1400 Florida Avenue
Lynchburg, VA 25401
We’ve compiled a list of Frequently Asked Questions and Answers for everything you need to know about Lynchburg Regional Juvenile Detention Center’s Inmate Mail Policies, Rules and Guidelines. If you still have questions after reviewing these FAQs, call 434-455-7878 for further assistance.
Learn even more ⇓ Learn more ⇓ Show lessCan I purchase Commissary Online for an Inmate in the Lynchburg Regional Juvenile Detention Center, and what can I purchase?
We’ve compiled a list of Frequently Asked Questions and Answers for everything you need to know about Lynchburg Regional Juvenile Detention Center’s Commissary Policies, Rules and Guidelines. If you still have questions after reviewing these FAQs, call 434-455-7878 for further assistance.
Learn even more ⇓ Learn more ⇓ Show lessHow Can I Communicate with an Inmate in the Lynchburg Regional Juvenile Detention Center using an Online Messaging Service?
Friends & Family Portal Information
Frequently Asked Questions
Instructions on How to Use CIDNET
CIDNET Instrucciones
Contact Customer Support
To send and receive secure texts or emails from an inmate housed in Bedford County follow these instructions:
For all the information you need to know, including instructions, policies, tips and solutions to possible issues with Texting and Emailing an inmate in Bedford County, visit our full page guide.
We’ve compiled a list of Frequently Asked Questions and Answers for everything you need to know about Lynchburg Regional Juvenile Detention Center’s Text and Email Policies, Rules and Guidelines. If you still have questions after reviewing these FAQs, call 434-455-7878 for further assistance.
Learn even more ⇓ Learn more ⇓ Show lessDo Inmates in the Lynchburg Regional Juvenile Detention Center have Access to Tablets or Computers?
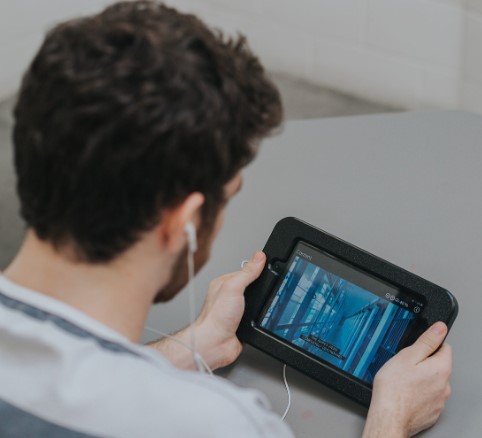
The tablets can be rented on a monthly basis and while not directly connected to the internet, the inmates can use them for the following activities:
Here's how it works:
We’ve compiled a list of Frequently Asked Questions and Answers for everything you need to know about Lynchburg Regional Juvenile Detention Center’s Tablet Policies, Rules and Guidelines. If you still have questions after reviewing these FAQs, call 434-455-7878 for further assistance.
Learn even more ⇓ Learn more ⇓ Show lessWhat are the other City and County Jails in Bedford County?
What are the other Jails in the Neighboring Counties surrounding Bedford County?
This facility, known as "Lynchburg Regional Juvenile Detention Center" is also known as Amherst County Juvenile Detention, Bedford County Juvenile Detention, Appomattox County Juvenile Detention, Campbell County Juvenile Detention, Charlotte County Juvenile Detention, Nelson County Juvenile Detention, Lynchburg Juvenile Detention, Bedford Juvenile Detention, Lynchburg Reg. Juvenile Detention Center - Bedford.
The Lynchburg Regional Juvenile Detention Center serves the following cities and towns of Bedford County: Bedford, Big Island, Moneta, Montvale and Thaxton.